
The practical answer to how to measure whether an inclusion program works is a loop, not a survey: define the outcome the program is supposed to change, record a baseline before it launches, then re-measure that same outcome on a fixed timeline with the results broken out by group. Attendance counts and testimonials do not count, because they look identical whether a program changed anything or not.
The hard part is not writing the survey. It is that most teams start measuring after the program is already running, which leaves them with a number and no way to know whether it moved.
Before the detail, the short answer:
- Decide what the program is supposed to change and write it as one specific outcome with a number attached, before launch day.
- Measure before you start. A post-program survey with no baseline is an opinion poll, not an evaluation.
- Keep the instrument stable. The same questions, the same scale, the same wording, so the two rounds are actually comparable.
- Break every result out by group. A single blended score hides the failure you were looking for.
- Ask about behavior, not just feelings, and pair survey data with HR process records and a small amount of qualitative work.
- Publish what you found, including what you are not fixing yet, then decide with a rule you set in advance.
This guide works for employers, school and district leaders, nonprofits, and community organizations running inclusion programs for staff, students, or members. Budget a few weeks of setup before launch and a few days of analysis per cycle after that.
Table of Contents
- What You Need
- A written statement of the program’s purpose
- A logic model, even a rough one
- Participation and access records
- Baseline and comparison data
- An anonymous feedback instrument
- Demographic and access data, with a privacy rule attached
- A named owner and a decision rule
- Step-by-Step: How to Measure Whether an Inclusion Program Works
- 1. Define the Program’s Intended Outcomes
- 2. Establish a Baseline and Choose Indicators
- 3. Measure Reach, Participation, and Completion
- 4. Measure Changes in Experiences and Behavior
- 5. Check Whether Benefits Are Distributed Equitably
- 6. Analyze Results and Decide What to Improve
- Common Mistakes
- Treating attendance as success
- Starting the measurement after launch
- Asking leading questions
- Publishing one blended score
- Comparing unlike groups
- Treating anecdotes as proof
- Collecting feedback people could be identified from
- Measuring and never reporting back
- Frequently Asked Questions
- How long does it take to know whether an inclusion program works?
- How many survey responses do you need for the results to be trustworthy?
- Can a program be working even if the overall inclusion score barely moved?
- Does a high satisfaction score mean inclusion is real?
- How do you know the program caused the change rather than a broader trend?
- How do you measure inclusion without running a survey?
- Conclusion
What You Need

You cannot evaluate a program you never defined. Before any data collection, gather seven things.
A written statement of the program’s purpose
One paragraph on why the program exists, who it is for, and what it is meant to change. If the paragraph cannot name a change in access, treatment, voice, or opportunity, the program is a statement of values rather than an intervention, and it will be very hard to evaluate honestly.
A logic model, even a rough one
Map inputs to activities to outputs to outcomes. A mentoring program might spend staff time and budget (inputs), run matched pairs and monthly check-ins (activities), produce 40 matched pairs (outputs), and change promotion interest and sponsorship access (outcomes). The map tells you which outcomes the program could plausibly move, which protects you from measuring something it had no chance of affecting.
Participation and access records
Who was invited, who enrolled, who attended, who completed, and who dropped out, with the reasons where people gave them. Most access gaps show up here before they ever show up in a survey.
Baseline and comparison data
Whatever the outcome is, you need its starting value. Where you can, also identify a comparison point: a similar team or school that did not run the program, a prior cohort, or the same measure from an earlier year.
An anonymous feedback instrument
A short survey with fixed response scales, drafted early enough to pilot. Twenty to thirty well-chosen items beat eighty, mostly because long surveys get abandoned and the people who abandon them are usually the busiest.
Demographic and access data, with a privacy rule attached
Self-identification data from staff, students, or members, held under a stated confidentiality standard. Decide in advance what the minimum group size is before you report a group’s average. Five responses in a cell is a conversation, not a finding.
A named owner and a decision rule
Someone who owns the analysis, and a written rule for what happens next: what result means continue, what means adjust, and what means stop. Set that rule before you see the data, because the version written afterwards always suits the answer you wanted.
Step-by-Step: How to Measure Whether an Inclusion Program Works
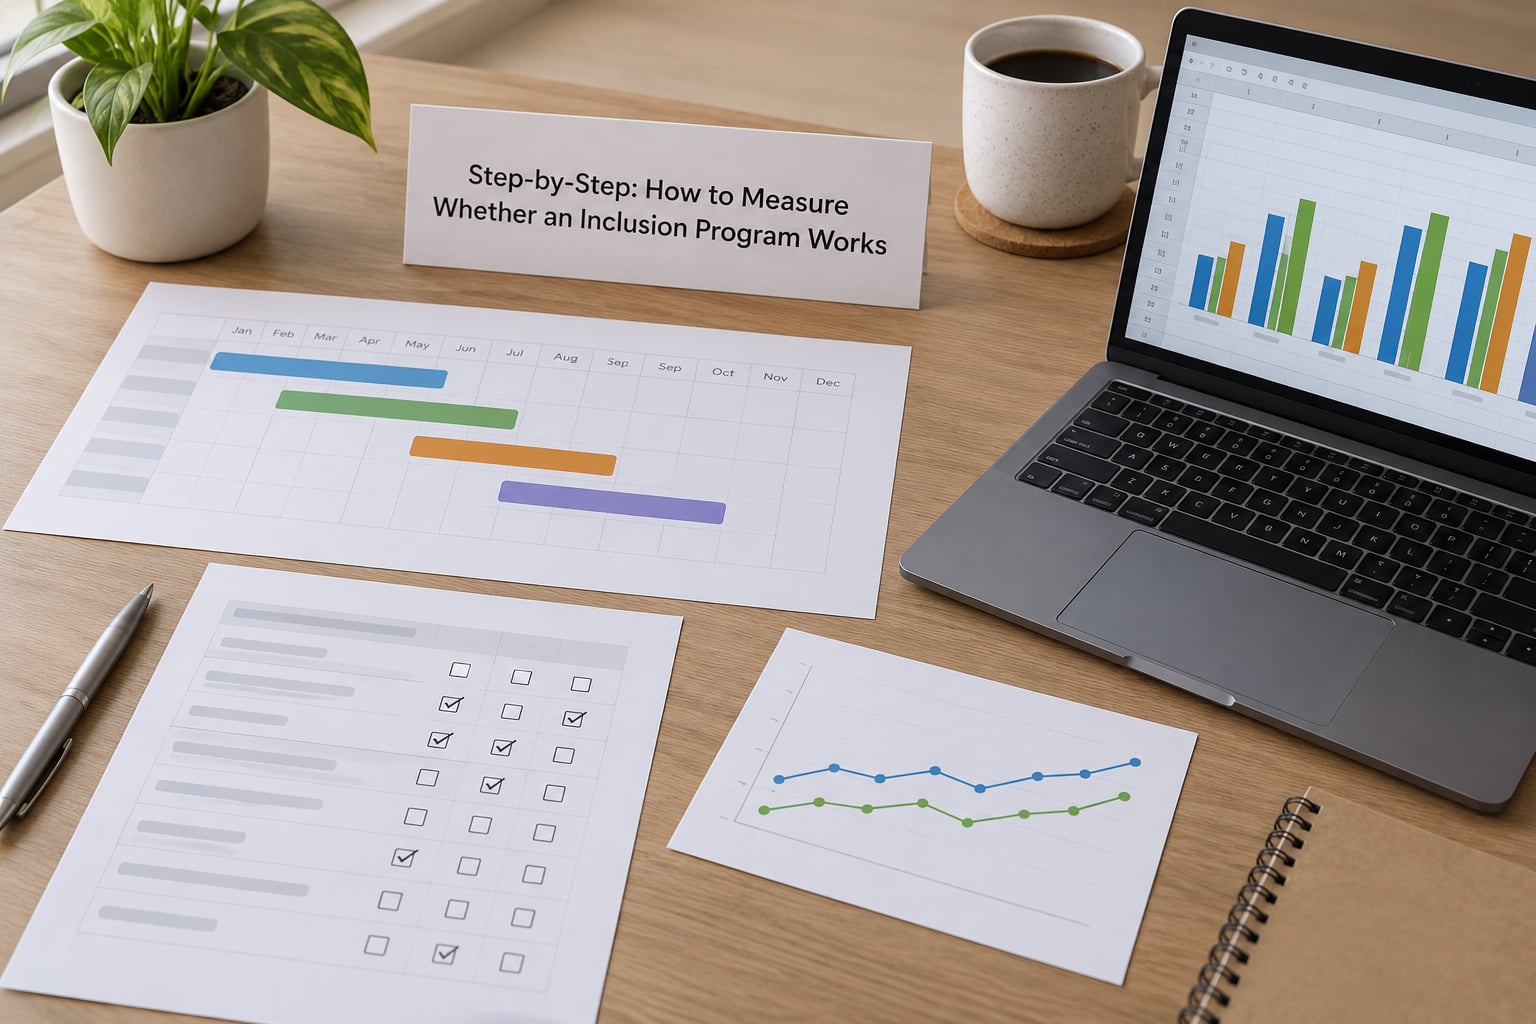
Six steps, run in order, then repeated on a cycle: define the outcome, set the baseline, measure reach, measure experience and behavior, disaggregate by group, analyze and act. The loop matters more than any single instrument, and skipping the first two steps is what produces flattering evaluations that prove nothing.
1. Define the Program’s Intended Outcomes
Write down what success looks like before you measure anything, in language someone else could score without asking you what you meant. “Improve belonging” cannot be scored. “Belonging rises from 62 to 72 points on a five-point item, measured at six and twelve months, with no widening gap between groups” can.
Pick two or three outcomes at most. Inclusion program evaluation fails more often from over-collection than from under-collection, because a team that tracks twelve things reports the two that moved and quietly drops the rest.
Useful outcome categories for this kind of work are access, participation, belonging, fair treatment, voice in decision-making, and opportunity. Most real programs sit inside two of them.
2. Establish a Baseline and Choose Indicators
Record the starting conditions for each outcome before the program begins. This is the step teams skip, and skipping it means every later number has to be interpreted with an assumption you cannot check.
Choose indicators in three groups. Process indicators describe delivery: sessions held, mentors matched, materials distributed. Perception indicators describe experience: belonging, psychological safety, perceived fairness, trust in leadership. Outcome indicators describe what changed in the organization: promotion and succession rates, discipline patterns, retention, discretionary effort, referral and enrolment patterns.
Process indicators confirm the program ran. They tell you nothing about whether it helped, which is why a program that reports twelve sessions delivered and no outcome data has measured its calendar rather than its effect.
If you are working in education, there is a ready-made indicator architecture worth borrowing: the OECD framework built from the Pacific Indicators for Disability-Inclusive Education produces 48 indicators, 12 of them core, organized around participation, learning environments, and outcomes. Adapt the structure rather than importing the measures wholesale. The UN’s work on measuring social inclusion in a global context offers a similar architecture for community and nonprofit settings.
3. Measure Reach, Participation, and Completion
Calculate who was invited, who took part, who finished, and how those numbers changed between groups and between cycles. This is the layer where you find out whether the program reached the people it was built for.
A common finding is that a program scores well overall and underperforms badly for one specific group, usually because the access mechanics quietly favour people who already feel comfortable. Voluntary programs, daytime sessions, and self-nominated mentoring all show this pattern. If your reach numbers show a gap, that gap is a result, and it belongs in the report next to the survey scores.
Completion rates matter as much as participation. A program where most people join and half finish has an implementation problem that no amount of favorable sentiment data will fix.
4. Measure Changes in Experiences and Behavior
Use anonymous surveys as the backbone, then add sources that do not depend on people self-reporting. Surveys are the fastest route to comparable numbers over time. They are also the easiest instrument to design badly, so pair them with interview evidence, process records, and observation.
Survey items should be behaviours, not adjectives. Ask whether someone has been interrupted in a meeting, whether they have access to the decision-maker, whether their work was credited, rather than whether the culture is inclusive. Behavioural wording gives you something to act on and something that can be corroborated.
| Method | What it captures | Cost and time | Best for | Main weakness |
|---|---|---|---|---|
| Pulse survey | Comparable scores on a few fixed items, repeated often | Low cost, a few days per cycle | Tracking direction of travel quickly | Too short to explain why a score moved |
| Annual census survey | Broad coverage with demographics and many dimensions | Moderate cost, several weeks per year | Disaggregation and benchmarking over time | Slow, and response rates drift downward |
| Interviews and focus groups | Mechanisms, language, and the stories behind a number | Moderate to high, several weeks | Understanding a result you did not expect | Not generalizable, so never quote it as a rate |
| Process audit | Who advanced, who was passed over, at which stage | Low to moderate, mostly analyst time | Hiring, promotion, discipline, and pay decisions | Shows the mechanism, not the experience |
| Behavioral proxy | Patterns in existing records: networks, promotions, credit | Moderate, needs data skills | Testing claims when surveys are not trusted | Easy to misread without context |
| Observation rubric | What happens in a room, rated the same way each time | High, needs trained observers | Classrooms, meetings, hiring panels | Observer drift if rubrics are not recalibrated |
Several named frameworks can save you from inventing a scale. The Gartner Inclusion Index measures seven dimensions: fair treatment, integrating differences, decision-making, psychological safety, trust, belonging, and diversity. McKinsey’s model separates personal experience from enterprise perception, which surfaces the gap between how the organization seems and how individuals actually feel. Commercial instruments such as the Culture Amp and Paradigm IQ inclusion surveys are widely used and report against internal benchmarks.
One caution on those numbers. Most of the widely quoted inclusion statistics come from specific studies with specific samples. Date them, name the source, and do not present them as universal.
5. Check Whether Benefits Are Distributed Equitably
Compare every outcome across the groups that matter to your program, not just against the overall average. This is where composite scores do their damage: an overall number can rise while the group with the lowest starting score gains nothing or falls further behind.
Report the gap, not just the level. If belonging sits at 72 overall but at 54 for one group, the story is a fifty-point story, not a seventy-two-point story. Where a group is small, report nothing at all and say why; a figure built on a handful of responses invites exactly the over-reading the confidentiality promise was meant to prevent.
Intersectional cuts deserve a cautious look. Two demographic variables multiplied together can leave cells too small to report safely, which is why most instruments publish single-dimension breakdowns rather than full matrices.
6. Analyze Results and Decide What to Improve
Compare each outcome against the target you set in step 1, then sort the findings into three buckets: the program did not reach enough people, the program reached them but did not change anything, or the program changed something for some groups and not others.
Those three buckets have different fixes. Poor reach is an access and communication problem. Poor delivery with no change usually means the activity is not the intervention people assumed it was, or the dosage is too low to matter. Uneven results point at design, most often at mechanics that quietly advantage people who already feel comfortable.
Then apply the decision rule you wrote in advance. Write the recommendation in one sentence with a named owner and a date, because a finding without an owner is a complaint. Re-measure on the same cycle with the same instrument, and keep going until the gap stops closing or the program stops earning its cost.
Common Mistakes
Most failed evaluations fail for the same handful of reasons, and most of them are cheap to fix in advance.
Treating attendance as success
Headcount, session counts, and application numbers describe delivery, not effect. They are worth reporting and they are never sufficient. Pair every delivery figure with at least one outcome figure or say plainly that you do not have one yet.
Starting the measurement after launch
Without a baseline, a post-program number cannot be interpreted. This is the single most common reason an organization simply cannot answer the question it hired the program to answer.
Asking leading questions
Items like “we are committed to an inclusive culture” invite agreement and produce a flattering score. Ask about specific recent experiences instead: the last meeting you attended, the last credit you received, the last time you raised a concern.
Publishing one blended score
A single inclusion index for the whole organization is comfortable to put on a slide and useless for finding out what to fix. Report by dimension and by group, and keep the composite only as a summary line beneath the detail.
Comparing unlike groups
Comparing a program team’s survey results with the organization’s, or one year with a different year measured on a different scale, produces movement that is an artifact of the comparison. Hold the instrument, the population, and the scoring constant.
Treating anecdotes as proof
One memorable account is a lead, not a finding. Use it to generate a hypothesis, then test it with data that could have come out the other way.
Collecting feedback people could be identified from
Small teams, narrow job types, or optional self-identification make anonymity hard to guarantee, and respondents can tell. Say who can see raw responses, publish only aggregated results, and set a minimum group size you will not report below. A survey people distrust produces worse data than no survey, plus a lasting trust cost.
Measuring and never reporting back
Collecting results and publishing nothing is the fastest way to end survey participation. Report what you found, what you changed, and what you decided not to change with the reason.
Frequently Asked Questions
How long does it take to know whether an inclusion program works?
Most inclusion program evaluations need two cycles to say anything useful: one baseline before launch and one follow-up three to six months later. Behavior change often shows up sooner than belief change, so process and HR record measures move first. Give mentoring or sponsorship programs a full academic or fiscal year before drawing conclusions, since promotion-relevant effects take longer than one cycle. Deciding the timeline before launch keeps you from declaring failure too early or success too late.
How many survey responses do you need for the results to be trustworthy?
Enough to report at the level you intend to report at, which is the rule most teams miss. A 400-person organization can read an overall score from around 120 responses, but a breakdown by group needs far more from each group you plan to name. As a working floor, aim for 30 to 40 responses in any cell you intend to publish, and suppress anything below that. Report your response rate next to every figure, because a 12 percent response rate is a self-selected group, not a sample.
Can a program be working even if the overall inclusion score barely moved?
Yes, and it is common. A blended score can stay flat while one group improves substantially and another declines, or while a process change takes hold before sentiment catches up. This is exactly why disaggregation matters: look at each dimension and each group separately, and check the behavioural and process measures, which typically move earlier. Judge the program on the outcome you wrote down in advance rather than on whatever number happens to look best afterward.
Does a high satisfaction score mean inclusion is real?
Not on its own. Satisfaction measures whether people feel content, which is compatible with a workplace that is comfortable and quietly unfair. Inclusion is closer to whether people have voice, are treated fairly, can bring a difference without paying for it, and can see a route to opportunity. Keep a satisfaction item or two for context, but do not let the satisfaction average stand in for the inclusion measures. Behavioural items and process audits are what stop that substitution.
How do you know the program caused the change rather than a broader trend?
You often cannot prove it from one before-and-after pair, and pretending otherwise weakens your credibility. Reduce the problem instead: run a baseline, hold the instrument constant, re-measure on a fixed cycle, and compare with a group that did not receive the program where you can find one. A staggered rollout across comparable teams gives you the closest thing to a counterfactual without a research budget. Where no comparison is possible, describe your finding as consistent with program effect rather than caused by it.
How do you measure inclusion without running a survey?
Use the records and observations you already generate. Audit who advanced at each stage of hiring, promotion, discipline, and pay. Look at credit and sponsorship patterns, retention by group, and referral or enrolment patterns. Rate meetings, classrooms, or hiring panels with a short observation rubric used consistently. These measures do not capture experience, so run them alongside a small amount of qualitative work: six to eight interviews will explain a process pattern better than another fifty survey responses.
Conclusion
Measuring whether an inclusion program works comes down to a loop you can defend: define the outcome, take the baseline, re-measure on the same instrument, break the results out by group, rule out other explanations, publish, and adjust. Programs that get judged this way stop being arguments about whether people feel positive and become questions about whether a specific gap closed.
Start with one outcome and one baseline. Write the number you expect and the number that would make you stop, then go and collect the first round.