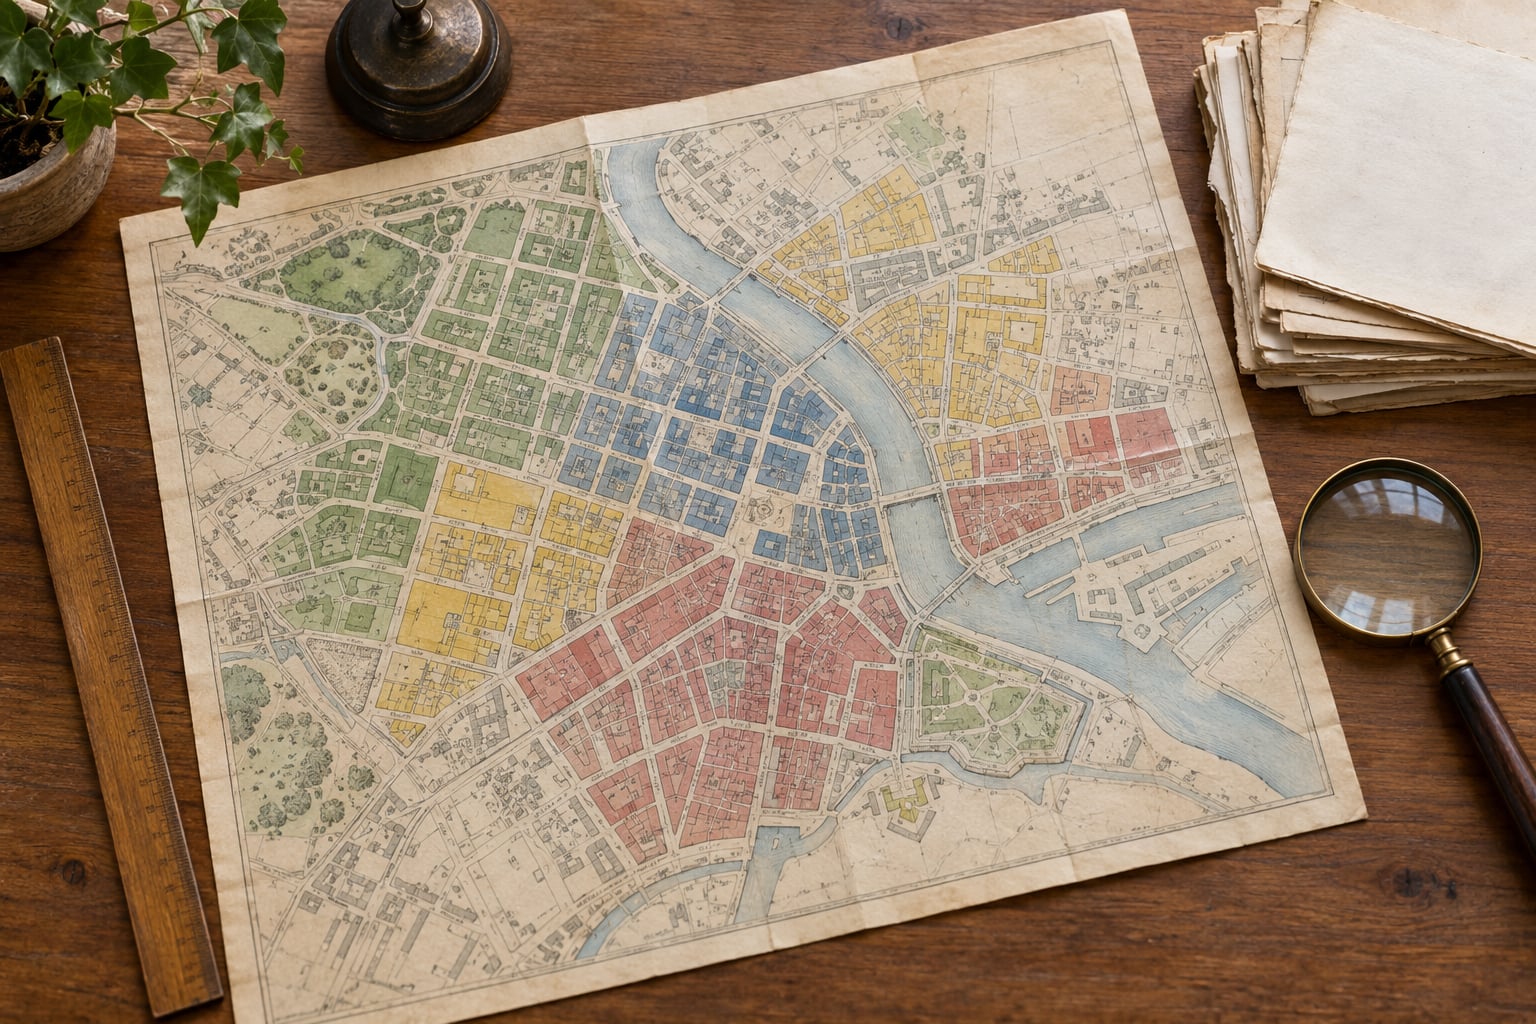
Redlining shaped American neighborhoods by turning a map into a mortgage policy. Between 1935 and 1940, the federal Home Owners’ Loan Corporation graded thousands of neighborhoods from A to D on color-coded maps, and banks, insurers, and federal loan agencies used those grades to steer credit away from blocks where Black, immigrant, and working-class families lived. The result was decades of skipped investment, lost home equity, and public services that never arrived. Understanding how redlining shaped American neighborhoods means tracing one decision made on paper and following where the money went, and where it refused to go, for the next eighty years.
People ask this question for personal reasons as often as academic ones. A homeowner in Milwaukee opens a 1938 federal map and finds nineteen areas shaded hazardous. A family in Philadelphia learns their parents were turned down for a loan in the 1950s while a cousin across town was approved. Those moments are not anecdotes bolted onto a policy story. They are the policy story, visible at the level of a single street.
This article walks through the definition, the history, the mechanisms, and the measurable effects. It also covers the part most explainers skip: how to look up the history of your own block, and which repairs are actually being tried now.
Table of Contents
- What Was Redlining?
- The History Behind Redlined Neighborhoods
- How Redlining Shaped American Neighborhoods
- Why the maps mattered: how redlining shaped American neighborhoods block by block
- Redlining and gentrification are not the same thing
- What Neighborhoods Were Most Affected?
- How the Policy Affected Housing and Wealth
- What Effects Can Still Be Seen Today?
- Housing and appraisal gaps
- Mortgage access
- Schools
- Environment and health
- Commercial disinvestment and transit
- Separate history from the present
- What Is Being Done to Address Redlining’s Legacy?
- Fair-lending enforcement and appraisal reform
- Community development finance
- Community land trusts
- Targeted public investment
- Local reparations and redevelopment
- How to Research Redlining in Your Own Neighborhood
- Frequently Asked Questions
- Did redlining directly determine every neighborhood’s current condition?
- What did redlining maps actually show?
- How did redlining affect homeownership and family wealth?
- Is housing discrimination still a problem in the United States?
- Why do some formerly redlined neighborhoods have lower home values today?
- What can communities do to address the legacy of redlining?
- Conclusion
What Was Redlining?
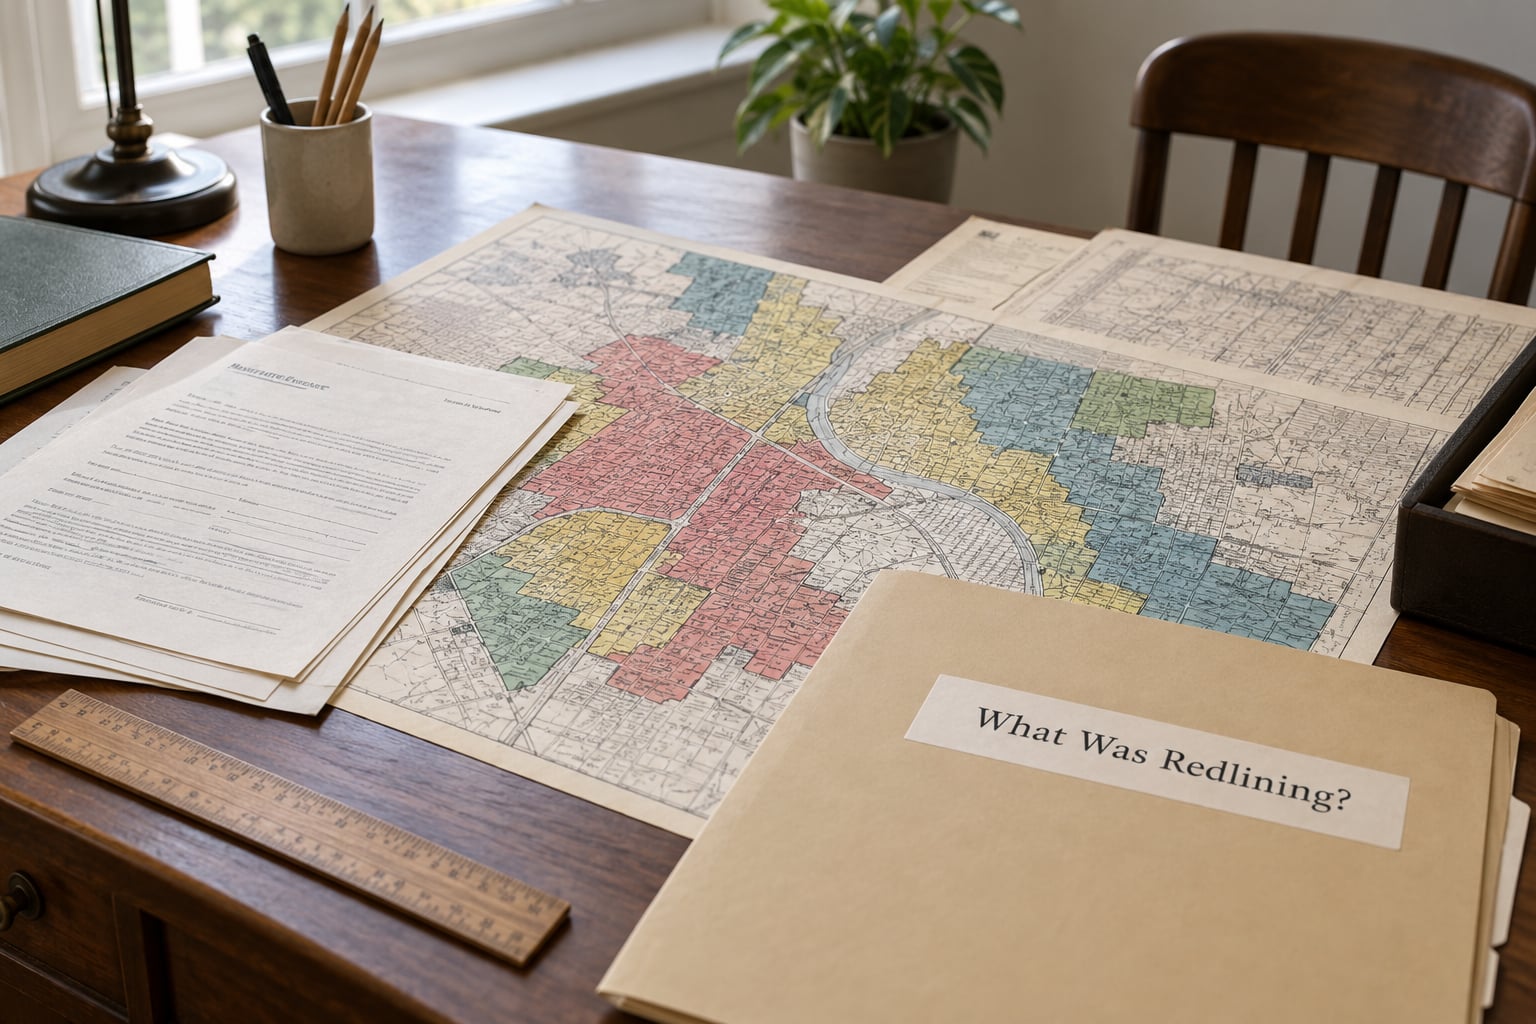
Redlining was a government-backed lending and insurance policy, formalized between 1935 and 1940, in which federal agencies graded American neighborhoods from A to D on color-coded maps and private lenders used those grades to deny mortgages, insurance, and investment to neighborhoods with large Black, immigrant, and working-class populations.
The Home Owners’ Loan Corporation was created under Franklin Roosevelt in 1935 as a New Deal agency meant to rescue homeowners from default during the Depression. It surveyed neighborhoods and assigned them a letter and a color. Those grades were then handed to banks, mortgage insurers, and appraisers as an apparently objective risk assessment.
It was not an individual landlord’s prejudice. That distinction matters, because it explains how the practice lasted so long and spread so far. A single biased agent can be replaced or sued. A federal agency’s map travels through the entire mortgage system, shaping thousands of decisions per year, for decades, in nearly every city and town that received a survey.
Grading also leaned on the race and class of residents rather than on housing condition or financial risk. Areas that were already aging and dense, often because federal policy had crowded people into them, were scored as risky. The logic closed on itself: a neighborhood was marked hazardous, which kept money out, which made it more run-down, which confirmed the original grade.
The History Behind Redlined Neighborhoods
Redlining did not arrive in 1935 out of nowhere. It landed on a housing market that private actors had already narrowed by law and by custom, and then it gave that narrowing a federal seal.
| Period | What Happened | Effect on Neighborhoods |
|---|---|---|
| 1910s to 1930s | Private covenants, blockbusting, and racial steering by developers, realtors, and local governments | Black families pushed toward certain blocks and excluded from expanding suburbs |
| 1935 to 1940 | HOLC surveys and produces color-coded A to D maps | Risk grades circulated to lenders and insurers as objective assessments |
| 1936 to 1949 | FHA and VA loan programs standardize underwriting manuals that rely on neighborhood grades and racial composition | Federal loan insurance effectively requires grading, and D-graded areas lose access to the largest share of new lending |
| 1949 to 1968 | Urban renewal, highway construction, and public housing projects clear occupied blocks | Displacement compounds earlier lending exclusion, often on top of already redlined land |
| 1968 | Fair Housing Act bans racial discrimination in sale, rental, and lending | Explicit race-based grading ends, though informal discrimination continues |
| 1977 onward | Community Reinvestment Act, fair-lending enforcement, appraisal reform, targeted public investment | Partial, uneven counterweights rather than an automatic remedy |
Richard Rothstein’s The Color of Law argues that the FHA manuals of the 1930s and 1940s mattered more than HOLC’s maps themselves. The maps described the risk; the underwriting manuals made the grading mandatory for anyone using federal loan insurance or Veterans Administration guarantees, which by the postwar era was most of the market.
Derek Black’s Schoolhouse Burning makes a related point about enforcement. Even where local governments never passed an explicit racial zoning law, they did not need to. Federal lending standards could do the work on their own, by tying the availability of a mortgage to the composition of a block.
How Redlining Shaped American Neighborhoods
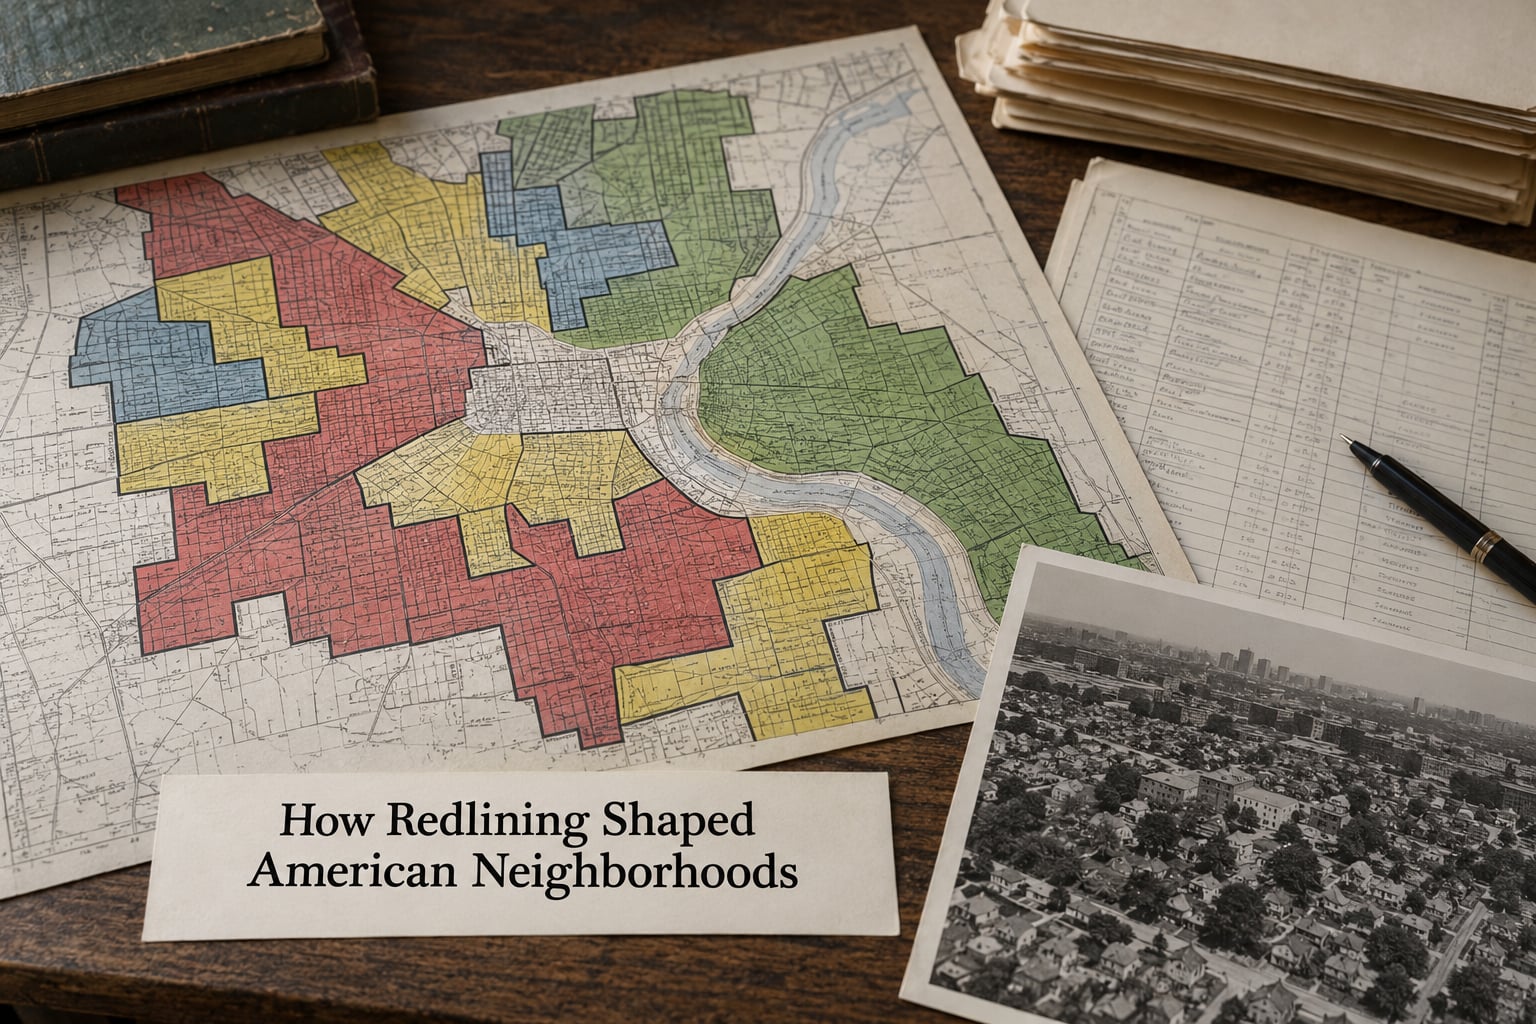
The mechanism is easy to describe and slow to see. A grade gets assigned, the grade travels with the paperwork, and capital stops. Here are the concrete channels through which that happened.
- Restricted credit. A D grade meant most conventional mortgages were unavailable, or available only on terms that most families could not meet. Families who wanted to buy in a D area often had to go through a lender willing to accept lower loan-to-value ratios or shorter terms, which meant larger down payments.
- Lower property values. When buyers cannot finance a block, the price of houses there falls relative to nearby blocks. That price gap is the mechanism by which a policy decision turns into a family balance sheet.
- Homeownership that never compounds. Families who did buy often held on, but without refinance cash or appreciation, the equity that builds in an appreciating neighborhood never accumulated.
- Housing stock left out of the renovation wave. Without refinance money and conventional repair loans, multifamily and older housing aged. Deferred maintenance became structural.
- Thinner commercial corridors. Retail follows mortgage and household income. Areas with less wealth attract fewer businesses, which keeps foot traffic down and reinforces the case for further disinvestment.
- Public services funded by property tax. Local revenue depends heavily on assessed value. Lower values mean fewer dollars per student and fewer city services, without anyone voting for it.
- Compounding through urban renewal. Highways, slum clearance, and public housing frequently cleared the same areas that had already been graded hazardous, and the displaced residents had to restart somewhere with less capital.
- Record and identity effects. Long-term residents absorb the message that their neighborhood was a write-off. That shows up in community trust, political participation, and the willingness of institutions to invest at all.
Why the maps mattered: how redlining shaped American neighborhoods block by block
The scale is easy to underestimate. HOLC’s surveyors covered hundreds of cities and thousands of neighborhoods, and later the Veterans Administration produced its own maps. Millions of Americans have looked up an address on one of these maps and found out that a federal agency once wrote a letter about their street.
The NationalNeighborhoodData project at Harvard and the University of Richmond’s Mapping Inequality archive have digitized most of the surviving HOLC maps, which is why ordinary people can now do a lookup that used to require an archivist.
Redlining and gentrification are not the same thing
People often ask whether redlining and gentrification are the same. They are not, and the difference is worth holding onto. Redlining pushed investment out of a neighborhood under government and lender power. Gentrification is a market-driven influx of capital that often pushes existing residents out.
When white newcomers move into a Black neighborhood, the usual word is gentrification, and the more precise phrase is residential displacement. There is a real distinction the word often hides: when newcomers are renters or neighbors rather than investors or speculative buyers, the shift is better described as integration or demographic transition. Long-time residents rarely feel the difference the way outsiders assume they do.
The two processes can also arrive in sequence in the same place. Capital was withheld for decades, then arrives at once.
What Neighborhoods Were Most Affected?
Redlining was national and it was not uniform. Roughly two-thirds of the graded neighborhoods received a C or D rating, and Black residents were heavily concentrated in those areas, but the pattern took different shapes depending on the local housing market.
Black communities bore the heaviest load almost everywhere, particularly in cities that had grown rapidly during the Great Migration and were receiving Black families in large numbers. In Milwaukee’s 1938 federal map, nineteen areas were marked hazardous. In New York City, the grades ran through Harlem, Bedford-Stuyvesant, the South Bronx, East New York, Corona, Elmhurst, and Red Hook. Those are examples, not boundaries, and Mapping Inequality is the place to check an actual block rather than guess.
Other groups were caught in the same grades. Puerto Rican, Mexican American, Chinese American, Japanese American, Native American, and immigrant communities in cities from the Northwest to the Midwest all appear on C and D shaded maps. Restrictive covenants and exclusionary zoning had already narrowed where many of these families could settle before HOLC graded anything.
Location mattered as much as race. Neighborhoods near heavy industry, rail corridors, and freight routes were graded harshly because industry was judged a risk, which meant that working-class white neighborhoods could be D-graded too. Industrial siting decisions, highways, and airport and stadium placements then compounded the earlier grades in ways that often erased mixed communities entirely.
How the Policy Affected Housing and Wealth
The economic argument for redlining was always that the grading protected lenders from risk. The evidence researchers have gathered since points the other way. When a block is written off, the value of every house on it falls, which reduces the collateral the next borrower could offer, which raises the risk for the lender who is still willing to lend. The grading system manufactured the risk it claimed to measure.
| Immediate Effect (1930s to 1950s) | Long-Term Consequence |
|---|---|
| Conventional mortgages unavailable in C and D areas | Homeownership rates in formerly redlined blocks remain well below comparable areas today |
| Appraised values suppressed | A persistent value gap that shows up again every time a family tries to borrow against the house |
| Fewer renovation loans | Aging housing stock, deferred maintenance, and concentrated code problems |
| Thin retail and business base | Fewer amenities, fewer employers, and long vacancies on commercial corridors |
| Lower property tax base | Underfunded schools and city services that depend on local collections |
| No refinance or sale windfall | Intergenerational wealth that never formed for families who stayed put |
The compounding is what makes this more than a story about house prices. A family that cannot refinance cannot fund a repair. A block with deferred maintenance collects fewer dollars per student. A child in an underfunded school faces a weaker labor market later, which is a different kind of exclusion, one the map never mentioned.
Many long-time residents describe the same sequence. They bought in, they stayed, and they never got the loan that would have let them improve the property. Over a generation, neighbors who bought in graded areas accumulated equity while neighbors a few blocks away did not.
What Effects Can Still Be Seen Today?
Most researchers are careful to say redlining is one cause among several, not a single explanation for every neighborhood outcome. Income trends, industrial decline, highway siting, school funding formulas, and later zoning all matter. What the evidence does support is that historically redlined areas still differ measurably from comparable places.
Housing and appraisal gaps
Homeownership rates remain lower in formerly redlined areas, and Black and Hispanic homeowners are still more likely to face appraisal discrimination, where the value assigned to a home differs based on the race of the owner or the composition of the neighborhood. The 2020 appraisal bias study reported in Science found that Black-owned homes in predominantly Black neighborhoods were appraised below comparable homes in similar financial condition, while the gap narrowed where Black neighbors were a smaller share of the area.
Mortgage access
Mortgage denial rates have fallen overall, but denial still falls unevenly. Black and Hispanic applicants are denied at higher rates than white applicants with similar credit profiles, and the Department of Housing and Urban Development and the Consumer Financial Protection Bureau continue to publish enforcement actions over discrimination in underwriting and appraisal.
Schools
A 2022 Albert Shanker Institute study by Bruce Baker, Matthew Di Carlo, and Preston C. Green III examined seven metropolitan areas including Baltimore, the San Francisco Bay Area, Birmingham, Hartford, Kansas City, San Antonio, and the Twin Cities. It found that states provide districts serving predominantly poor students roughly six thousand dollars per pupil less than those districts need, which means local property tax revenue does more of the work in poorer communities, and property values in historically redlined blocks are lower.
Environment and health
David Nowak, Eric Greenfield, and Alexis Ellis published research in Landscape and Urban Planning in 2022 that compared 1930s HOLC grades with 2010 tree canopy data across 1,259 census places. Areas graded hazardous had less tree cover and more impervious surface today, which matters for stormwater management, summer heat, and household energy costs. The same neighborhoods also tend to sit closer to highways and industrial sites.
Commercial disinvestment and transit
Retail vacancy and small-business formation lag in formerly redlined areas, and transit service and frequency historically followed investment. A neighborhood that lenders treated as hazardous in 1937 often got the bus routes and the store openings that follow lender decisions rather than need.
Separate history from the present
Some readers push back by pointing out that parts of New York City and other formerly redlined corridors are now extremely expensive. That objection deserves a straight answer. Redlining shaped where capital went; it did not assign a single destiny. Neighborhoods near universities, waterfronts, or job centers got lifted by later cycles of investment that have little to do with their grade. The pattern holds on average, not for every block.
Today, yes, people are still discriminated against in housing, and the protected categories go beyond race. Under the Fair Housing Act of 1968 and its amendments, protections cover national origin, religion, sex (including gender identity and sexual orientation), familial status, and disability, and the pattern of who is discriminated against changes over time. Those rules arrived after the HOLC maps, and they did not erase them.
What Is Being Done to Address Redlining’s Legacy?
Nothing on the list below is a full repair, and it would be dishonest to present them as one. These are partial, contested, and unevenly funded responses.
Fair-lending enforcement and appraisal reform
The Consumer Financial Protection Bureau has brought enforcement actions against lenders and appraisal companies and pushed for standardized appraisal models that ignore protected-class information. Critics say enforcement has weakened and that the underlying appraisal industry incentives have not changed much.
Community development finance
Community development financial institutions, the HOME program, and CDFI Fund lending target low-income areas that the mainstream mortgage market skips. The volume of this capital is a fraction of what left these neighborhoods during the exclusion era.
Community land trusts
A community land trust buys land and keeps it in trust, then leases homes to residents at controlled prices. The build-up in value stays with the trust rather than being captured by an outside buyer, which keeps homes affordable across ownership changes. Most CLT homes serve households well below the area median income, so they address stability and wealth retention more than outright new homeownership for families who were previously shut out.
Targeted public investment
Environmental justice funding, capital projects, and infrastructure dollars aimed at disadvantaged communities are the largest new federal push, though how much reaches the neighborhoods identified on HOLC maps depends on how agencies define need.
Local reparations and redevelopment
Philadelphia has commissioned the most detailed local redlining investigation of any US city, led by attorney Nelson Mandela Wright, which documented how the city’s own policies compounded federal lending discrimination. A small number of cities have pursued reparations or housing creation funds; most have not, and local politics determines which.
How to Research Redlining in Your Own Neighborhood
This is the step people thank us for, so it is written out plainly.
- Go to Mapping Inequality. The University of Richmond project hosts the digitized HOLC maps and area descriptions. The address search is the fastest route, and the site is free.
- Read the area description, not just the color. Each survey sheet includes a typed description of the block and a list of the residents, occupations, and nationalities the surveyor recorded. That text is often more revealing than the grade.
- Check which agency graded it. HOLC maps run roughly 1935 to 1940. The Veterans Administration produced later maps for many cities, and the FHA’s own underwriters used the grades without publishing new ones.
- Note the grade’s letter, color, and label together. A, green, was the best; D, red, was hazardous. Many people know the colors but not the letter grades, and the labels carried the explicit racial language.
- Compare the grade to today. Look up current homeownership rates, property values, and school funding for the same tract. The comparison is where the history turns into something you can hold.
- Save the sheet. Local historical societies, libraries, and city archives collect these maps, and residents’ own copies are now part of the permanent record.
One caution: an address search can surprise you in either direction. Some blocks people expect to find graded hazardous are not, because HOLC never surveyed them, and the absence of a grade is not evidence that the neighborhood was treated fairly.
Frequently Asked Questions
Did redlining directly determine every neighborhood’s current condition?
No. Redlining shaped where capital went, which is why neighborhoods differ on average today, but it did not assign a single destiny to any block. Industrial decline, highway siting, income trends, school funding formulas, and later zoning all shaped the same places. Some formerly redlined corridors near job centers or waterfronts have since appreciated sharply.
What did redlining maps actually show?
HOLC surveyors walked neighborhoods between 1935 and 1940 and shaded them from A to D on city maps, with A in green and D in red and marked hazardous. Each sheet included a typed description of the block listing residents, occupations, and nationalities. The grade was presented to lenders and insurers as an objective measure of investment risk.
How did redlining affect homeownership and family wealth?
In C and D graded areas, most conventional mortgages were unavailable or priced on terms families could not meet. Buyers who did get in often could not refinance, so the equity that builds through appreciation and renovation never formed. That missing equity compounded across generations and is a large part of the racial wealth gap in homeownership.
Is housing discrimination still a problem in the United States?
Yes. Explicit race-based grading ended with the Fair Housing Act of 1968, but discrimination continues in underwriting, appraisal, and advertising. Black and Hispanic applicants are still denied at higher rates, and appraisal bias studies have found Black-owned homes appraised below comparables in predominantly Black neighborhoods. Federal enforcement remains active through the CFPB and HUD.
Why do some formerly redlined neighborhoods have lower home values today?
Because restricted credit for decades kept values depressed and skipped the renovation wave that builds equity, so much of the stock aged. Lower assessed values then mean less local property tax revenue, which funds fewer services and weakens the area further. Later shocks like industrial closure layered on top of that original gap.
What can communities do to address the legacy of redlining?
Start with the record: pull local HOLC grades, city policy history, and present-day outcome data, then use it in public. Communities have pushed for fair-lending enforcement, appraisal reform, community development capital, community land trusts, and reparations funds. Progress is uneven and mostly local, so the people who documented the block where they live tend to lead the work.
Conclusion
How redlining shaped American neighborhoods is not a question about one bad decade. It is a question about how a federal risk map became a self-fulfilling rule about which blocks deserved money, and how that rule kept compounding through refinancing, renovation, retail, schools, and transit for the next eighty years.
If you want to do something with that, start local. Find the grade for your own block, pull the current homeownership and property value data for the same area, and see how wide the gap is. Then look at the fair-housing and community-investment rules currently running in your city, because those are the levers that still move.